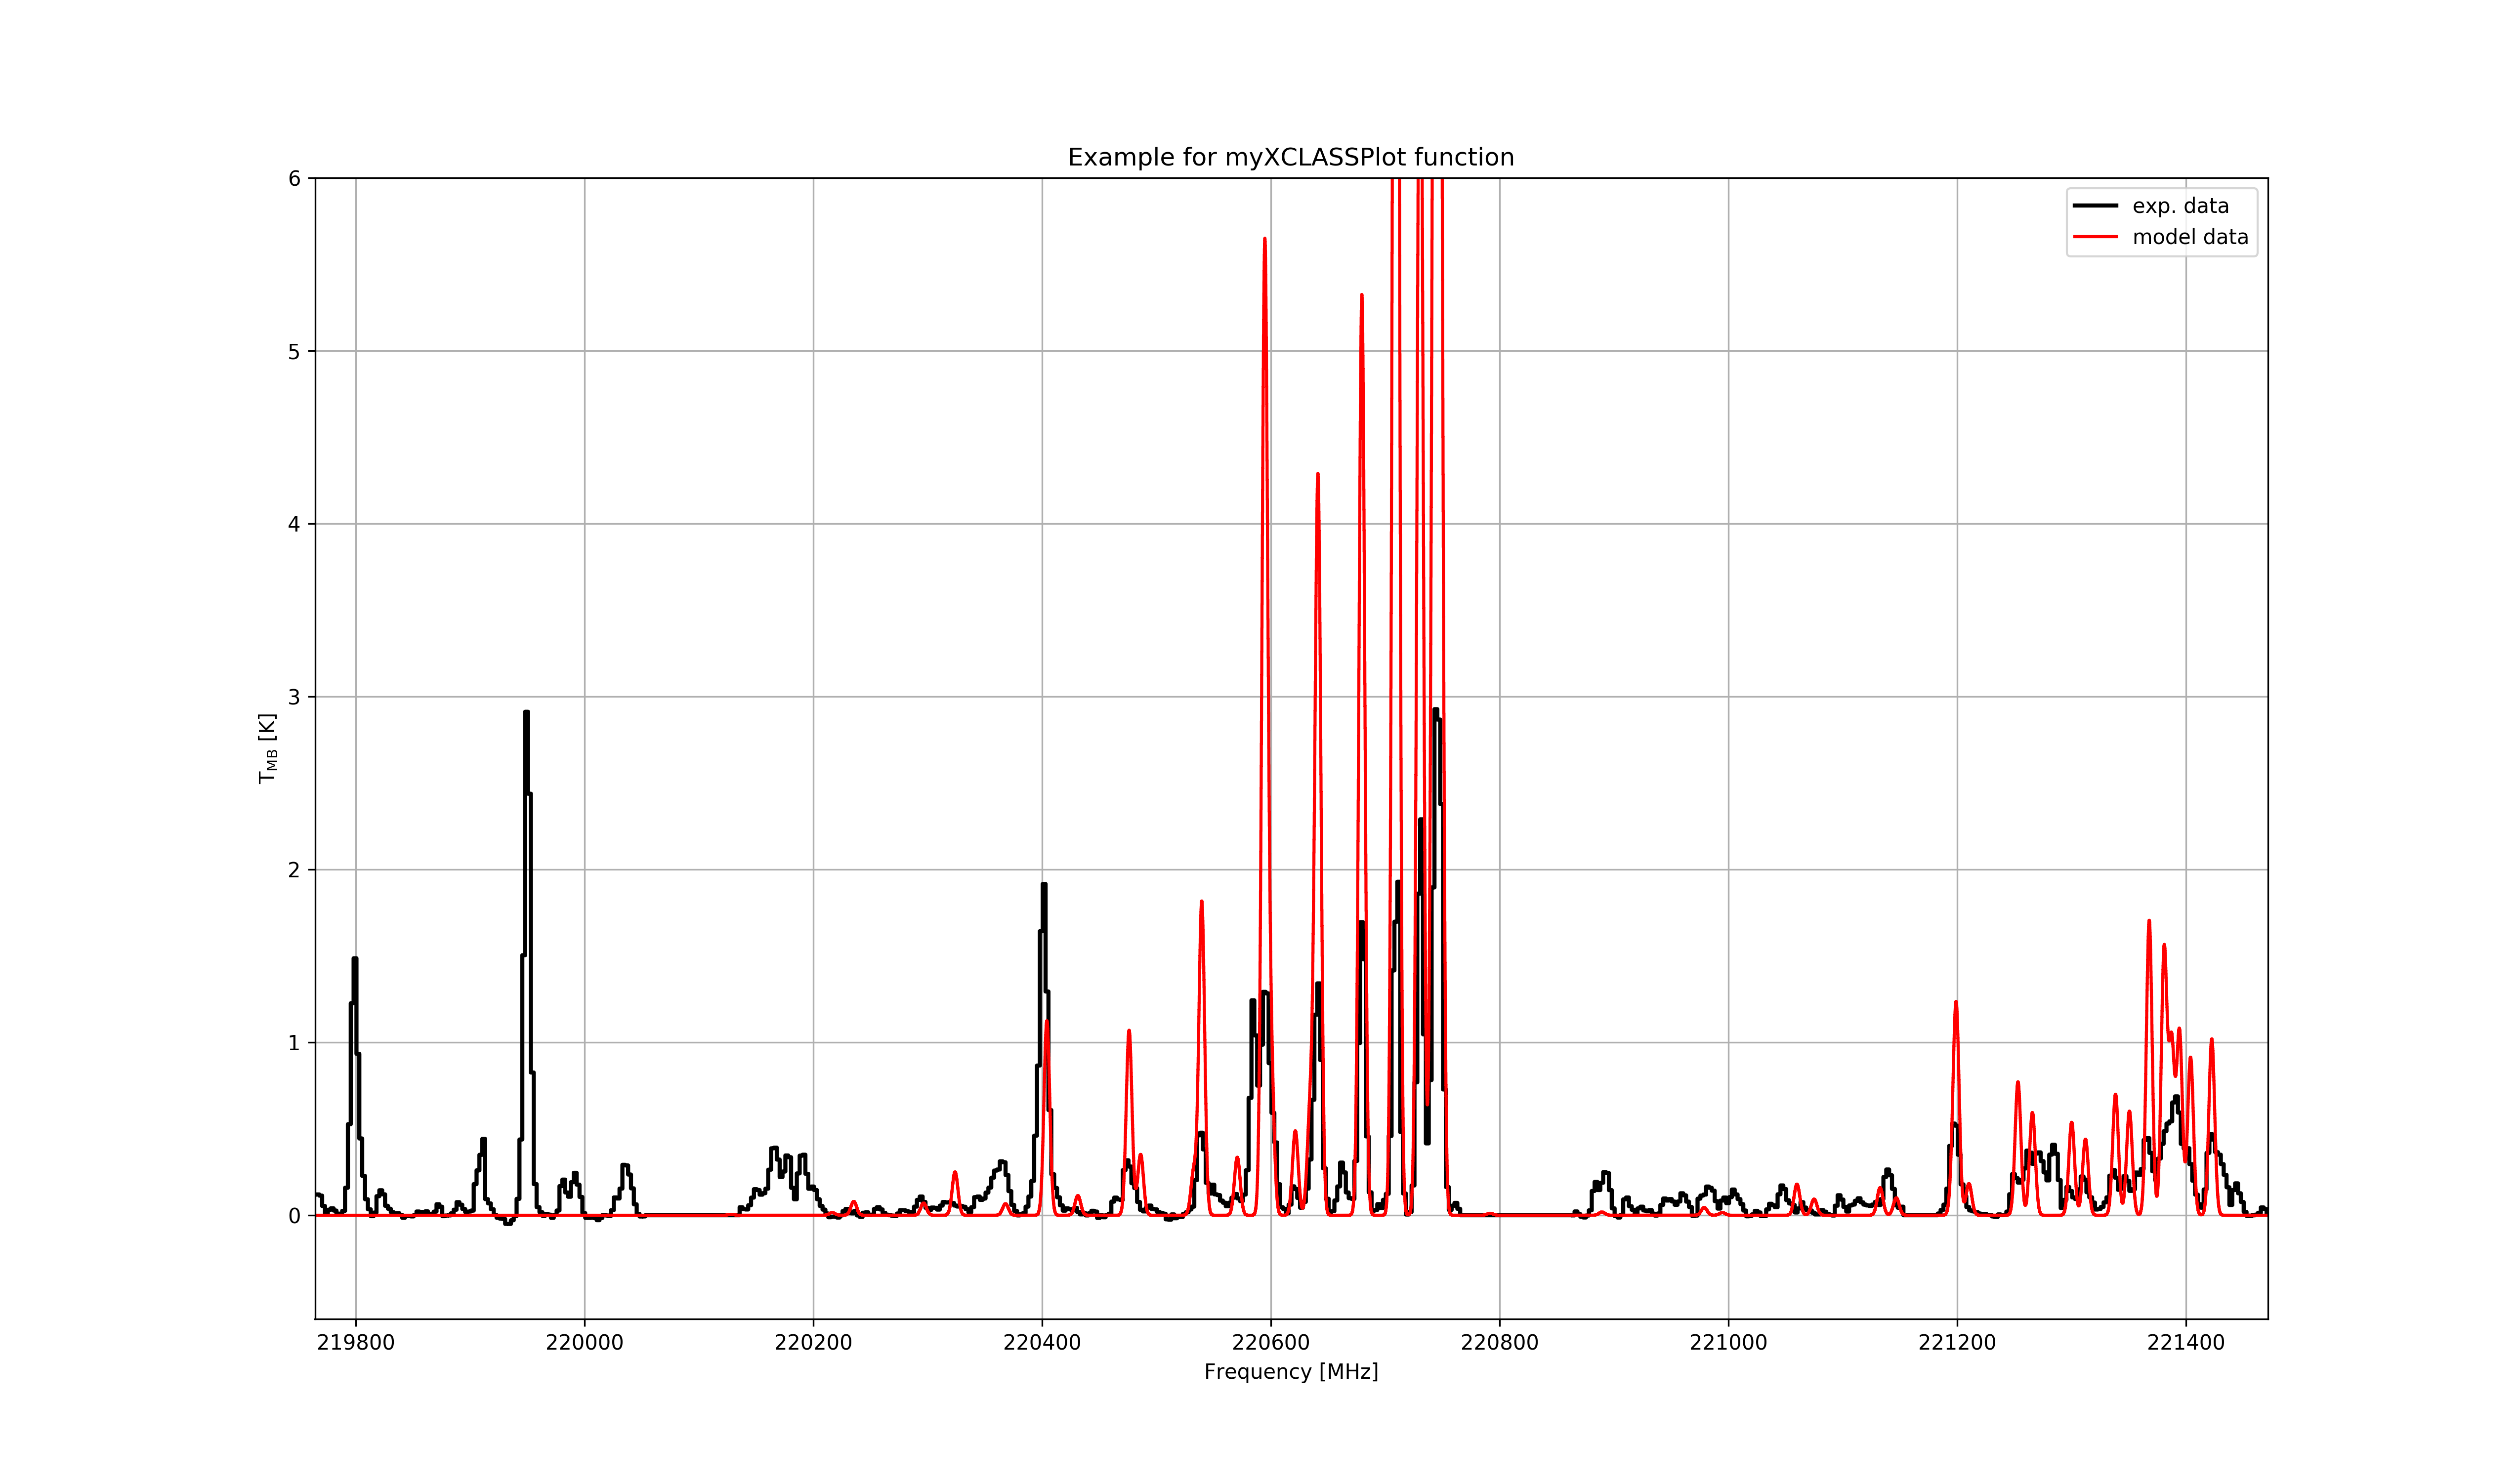
This function creates a plot showing the (observational) data stored in the parameter expdata as black dots, the calculated model function stored in the parameter modeldata as green line and the transition energies from the table transitions stored in the parameter TransEnergies as blue vertical lines.
Input parameters:
-
expdata: 2D numpy array containing the observational data Note, the data has to be given as a function of frequency (in MHz).
-
modeldata: 2D numpy array containing the values of a model function Note, the data has to be given as a function of frequency (in MHz).
-
TransEnergies: python list containing the transition frequencies (in MHz) from the last myXCLASS run, the Doppler-shifted transition frequencies (in MHz), the corresponding intensities (in K), the energy of the lower level (in K), the upper state degeneracy, the Einstein A coefficient (in s-1 ), and the molecule names.
-
RestFreq: rest frequency in MHz (default: 0). (If this parameter is set to zero, the intensity is plotted against frequency (in MHz) otherwise against velocity (in km s-1 ).
-
vLSR: velocity (local standard of rest) in km s−1 (default: 0), only used, if RestFreq != 0. (velocity(Frequency = RestFreq) = vLSR)
-
MinIntensity: minimal intensity (in K) of a transition for plotting molecule names (default: 0, i.e. plot all names)
-
xLowerLimit: lower limit (in MHz / km s-1 ) of the frequency/velocity (default: 0). (Depending on the value of the rest frequency: If rest frequency is set to zero, the lower limit has to be given as frequency) If parameter is not given, all data will be plotted.
-
xUpperLimit: upper limit (in MHz / km s-1 ) of the frequency/velocity (default: 1e8 ). (Depending on the value of the rest frequency: If rest frequency is set to zero, the upper limit has to be given as frequency) If parameter is not given, all data will be plotted.
-
yLowerLimit: lower limit of the intensity (y-axis) (default: 0). (If value is not given or if yUpperLimit is equal to yLowerLimit then the y-axis range is set automatically.)
-
yUpperLimit: upper limit of the intensity (y-axis) (default: 0). (If value is not given or if yUpperLimit is equal to yLowerLimit then the y-axis range is set automatically.)
-
PlotTitle: defines the title of the plot (default: "")
-
LegendFlag: defines, if legend is plotted (true) or not (false) (default: "T")
-
SaveFigureFile: defines the path and name of the file to which the current figure is stored. If no file is defined, i.e. "", the figure is shown in a GUI and not saved (default: "").
Output parameters:
-
None
Examples:
- plot the synthetic spectrum (with observational data)
# In CASA:
expdata = LoadASCIIFile()
modeldata, log, trans, IntOptical, JobDir = myXCLASS()
TransEnergies = trans
xLowerLimit = 218000.0
xUpperLimit = 230000.0
yLowerLimit = -1.0
yUpperLimit = 40.0
myXCLASSPlot()
Output:
Example scripts:
"my_plot_INcasa.py", "my_plot_OUTcasa.py"